
ETF Inflows Hit Eight-Day Streak
Bitcoin has pushed above the $80,000 mark, buoyed by a sustained streak of inflows into U.S. spot bitcoin exchange-traded funds (ETFs). Over the past eight sessions, these funds have attracted net new investments every single day, marking the longest such run since April. The cumulative inflow since this rally began stands at $2.8 billion, a figure that underscores renewed institutional interest as August draws to a close with three trading sessions left. This surge in ETF demand has coincided with bitcoin’s stabilization above $79,000 on Thursday, even as other digital assets lost ground.
While bitcoin’s price momentum has been strong, the context is more nuanced: altcoins have declined across the board during the same period, highlighting a divergence between bitcoin and the broader crypto market. According to coindesk.com, this pattern suggests that capital is concentrating in bitcoin itself rather than dispersing across riskier tokens.
Spot bitcoin ETFs have now logged eight consecutive days of net inflows, the longest streak since April 2024.
Supply Wall Nears ETF Break-Even
The current rally faces a significant technical obstacle: an extensive supply wall at $80,000. This cluster of sell orders aligns closely with the average purchase price of ETF holders, creating a zone where profit-taking could intensify and slow further gains. Bitcoin’s test of this level is also occurring near its 50-week moving average—a key trend indicator watched by traders for signs of longer-term momentum shifts.
Recent proprietary data shows BTC trading at $80,616 as of August 27, up just 0.03% over 24 hours and 0.12% over the past week. These modest percentage changes contrast with the headline-grabbing dollar value and point to a market pausing at a critical juncture rather than breaking out decisively.
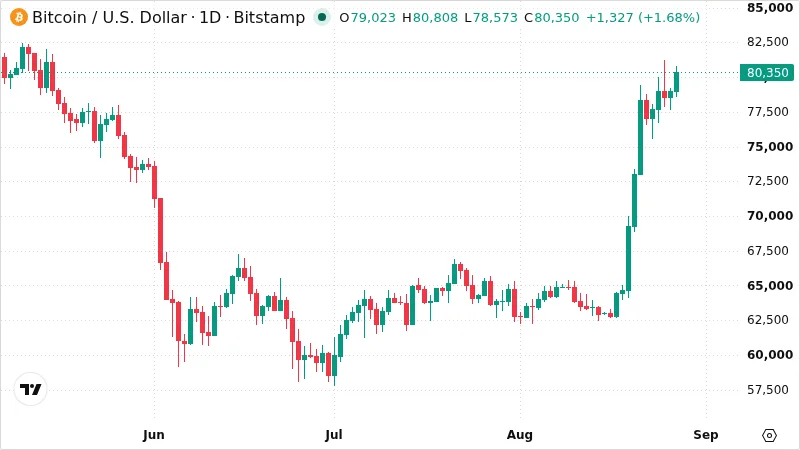
For many ETF investors, this area is not just resistance—it's their break-even line.
Patient Sellers Fill $83K Range
Beyond $80,000 lies another challenge: thickening liquidity between $81,000 and $86,000. Glassnode data highlights that much of this overhead supply comes from long-term holders—wallets that have kept their bitcoin for at least six months without selling through previous downturns. The first major self-custody cost-basis shelf emerges at $80,800, while dealer hedging activity (known as "gamma") flips negative at $82,300. These technical markers suggest that upward moves may face increased friction as price approaches these levels.
New sell orders have appeared on exchange order books in this range, and the so-called "patient-supply wall" now fills out the $83,000–$86,000 band. The presence of unsold long-term holder supply here means any advance will likely require significant new demand or a shift in holder conviction before resistance can be cleared.
See Also
August Poised for Record Inflows
If current trends hold through the final three sessions of August, this month could set a new record for U.S. spot bitcoin fund inflows not seen since October 2025. Ether ETFs are matching bitcoin inflows day for day—a rare occurrence that points to broadening institutional participation across top digital assets.
Despite these bullish signals in fund flows and price stability above $80,000, it’s unclear whether bitcoin can convert this area from resistance into lasting support. The headline number is impressive—an all-time high of $126,080 reached on October 6, 2025—but recent weeks have seen only incremental gains: just +0.27% over thirty days according to proprietary figures.
Ultimately, while ETF inflows are fueling optimism and market structure is supportive in some respects, thick liquidity walls and cautious long-term holders mean bitcoin’s next leg higher may require more than just steady fund flows to materialize.
The Lowdown
- •Spot bitcoin ETFs recorded eight consecutive days of net inflows, the longest streak since April 2024.
- •Bitcoin is testing a major supply wall at $80,000, near ETF holders’ average purchase price and the 50-week moving average.
- •U.S. spot bitcoin funds have attracted $2.8 billion in inflows since the current rally began, with three August sessions remaining.
What could move the market
If Bitcoin decisively breaks above the $80,000 supply wall—located near ETF holders’ average price and reinforced by new ask liquidity between $81,000 and $86,000—while ETF inflows continue their current streak (now at eight consecutive days and totaling $2.8 billion), immediate price action could test the $83,000–$86,000 range dominated by long-term holder supply; however, whether Bitcoin can flip $80,000 into support remains unclear.